Analysis: E
Key Findings and Interpretation
Dominant Factors and Interactions: The component Alginate (Alg) is the dominant factor driving the stiffness of the matrix, evidenced by its high linear coefficient (4.301). However, the mechanical behavior is not merely additive. The model reveals a critical, highly significant three-way interaction between Water, Alginate, and Calcium (P < 0.001). This confirms that the crosslinking density—and thus the modulus—is strictly dependent on the presence of Calcium acting upon the Alginate chains within the aqueous medium. Additionally, a marginally significant interaction exists between NcM2 and Calcium, suggesting the bacterial load may slightly influence the crosslinking efficiency.
Regression Equation
The relationship between the mixture components (Water, Alg, MNP, NcM2), the process variable (Calcium), and the response variable (E) is described by the following regression equation using coded units:
Model Goodness-of-Fit
The model demonstrates a reasonable fit for a complex biological encapsulation system, balancing model complexity with predictive capability.
- R-sq (65.01%): Indicates that approximately 65% of the variation in the modulus "E" is explained by the formulation components and their interactions.
- R-sq(adj) (59.54%): Adjusts for the number of predictors; its close proximity to the R-sq indicates that the model is not suffering from significant overfitting.
- R-sq(pred) (52.05%): Suggests the model has fair capability to predict new observations within the design space.
- S (0.1663): The standard error of the regression represents the average distance that the observed values fall from the regression line, which is acceptable given the range of the response variable.
Model Summary: Stepwise Selection
The following table shows the stepwise selection process for the final model. The last row, highlighted, represents the chosen model with the best combination of explanatory and predictive power.
| Step | Term Added | R-sq (%) | R-sq(adj) (%) | S |
|---|---|---|---|---|
| 1 | Linear Terms (Water, Alg, MNP, NcM2) | 36.86 | 31.29 | 0.2167 |
| 2 | Water*Alg*Calcium | 61.73 | 57.09 | 0.1712 |
| 3 | NcM2*Calcium | 65.01 | 59.54 | 0.1663 |
Model Diagnostic Plots
The residual diagnostics indicate that the model assumptions are generally satisfied, though a few observations warrant attention.
- Normality: The Normal Probability Plot generally follows a straight line. However, residuals for observations 9 (StdResid 2.72) and 28 (StdResid 2.16) deviate noticeably, representing potential outliers where the actual modulus was significantly higher than predicted.
- Constant Variance: The Residuals vs. Fits plot shows a random scatter of points around zero. There is no distinct "megaphone" pattern, suggesting the assumption of constant variance (homoscedasticity) holds, although the variance appears slightly higher at predicted values above 0.5.
- Independence: Assuming the Standard Order reflects the run order, the residuals appear randomized with no clear cyclic patterns or trends, satisfying the independence assumption.
Pareto Chart of Effects
In mixture designs, the Pareto chart cannot be used to rank the variables alone due to the constraint that components must sum to one; therefore, Cox response traces are necessary for accurate sensitivity analysis.
"The Pareto chart visually ranks the standardized effects, highlighting the Water*Alg*Calcium interaction and the linear Alg term as the most statistically significant contributors relative to the noise." However, the Cox Response traces confirm that Alginate has the steepest positive slope, indicating it is the most sensitive driver of response E. Increasing Alginate content (even by small amounts) results in the most rapid increase in modulus compared to MNP or NcM2.
Cox Response Trace Plot
Trace plot showing the sensitivity of the response to each component relative to a reference blend.
Optimization & Prediction
The optimization algorithm predicts a maximum response of 0.9866 at the formulation: Water (95.2%), Alginate (4.0%), MNP (0.8%), and NcM2 (0.0%) with High Calcium (Coded 1.0). This aligns perfectly with the model coefficients, maximizing the dominant structural component (Alg) and the crosslinker (Ca) while minimizing the softer bacterial component (NcM2). However, trade-offs are evident in the predicted responses; while "E" is maximized, other parameters such as WC (Water Content) are predicted to be 0.1644, which may be lower than desired for certain biological viability applications. The feasibility of this point depends on whether the high stiffness is prioritized over cell accommodation capacity.
Calculated Optimal Conditions (Maximized E)
0.9866
Optimal Formulation
- Water 95.2
- Alg 4.0
- MNP 0.8
- NcM2 0.0
- Calcium_Real 5
Predictions for Other Responses
- WC 0.1644
- RE 0.0696
- FE_FE0 0.0949
- Ms 0.2847
- FM 0.9072
- I1 0.2495
- I2 0.2537
- I3 0.255
- I4 0.2448
- I5 0.2973
Prediction Calculator
Enter component values to predict the response for E.
Custom Prediction
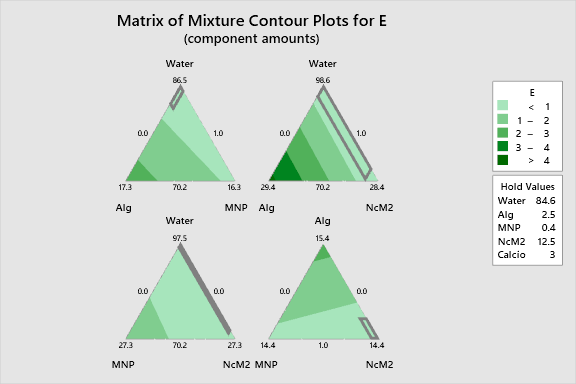
2D Contour Plots
The following interactive 2D contour plots show how pairs of variables influence the response while holding the other factors at constant levels. These maps are essential for identifying optimal regions in the formulation space.
The contours display a distinct gradient driven by the Alginate concentration. As we move toward the Alginate vertex, the response "E" increases. The interaction effects are visible as curvature in the contour lines when Calcium is high, demonstrating that the hardening effect of Alginate is amplified significantly in the presence of the crosslinking agent.
Alg Vs Mnp E
Alg Vs Ncm2 E
Mnp Vs Ncm2 E
3D Surface Plots
The following interactive 3D surface plots visualization provides a topographical view of the response surface. The surface exhibits a rising ridge topology.
The plot clearly illustrates that the maximum stiffness (E) is achieved not just by increasing Alginate, but by simultaneously maintaining high Calcium levels. The curvature introduced by the Water*Alg*Calcium term creates a non-linear ascent, showing that the synergistic effect of the hydrogel components is critical for achieving high mechanical strength.
3D representations of the response surface.