Analysis: FM
Key Findings and Interpretation
The analysis identifies MNP (Magnetic Nanoparticles) as a critical driver for the response, exhibiting a large positive linear coefficient (27.93). However, the system is highly interactive. The interaction between MNP and Calcium is statistically significant (P < 0.001) and positive, suggesting that the effect of MNP is amplified at higher calcium concentrations. Conversely, the interaction between Alginate and MNP is negative (coeff -48.2), indicating an antagonistic relationship between these two polymers regarding the FM response, though this is mitigated when Calcium is present (indicated by the positive three-way interaction).
Regression Equation
Model Goodness-of-Fit
The model demonstrates an exceptional fit to the experimental data, validating the chosen Extreme Vertices Mixture Design.
- R-sq (95.14%): Indicates that 95.14% of the variation in FM is explained by the chosen mixture components and their interactions.
- R-sq(adj) (94.2%): Adjusts for the number of terms in the model; the high value confirms that the added interaction terms are adding real value rather than noise.
- S (0.0704): The standard error of the regression is low, implying that the observed data points fall very close to the regression line.
- R-sq(pred) (93.34%): This high value confirms the model's strong ability to predict the FM response for new observations within the design space.
Model Summary: Stepwise Selection
The following table shows the stepwise selection process for the final model. The last row, highlighted, represents the chosen model with the best combination of explanatory and predictive power.
| Step | Term Added | R-sq (%) | R-sq(adj) (%) | S |
|---|---|---|---|---|
| 1 | Linear Terms (Base) | 78.99 | 77.13 | 0.1399 |
| 2 | MNP*Calcium | 93.90 | 93.17 | 0.0765 |
| 3 | Alg*MNP | 94.56 | 93.71 | 0.0734 |
| 4 | Alg*MNP*Calcium | 95.14 | 94.20 | 0.0704 |
Model Diagnostic Plots
The diagnostic plots generally validate the assumptions of the ANOVA, though specific observations warrant attention.
- Normality: The majority of residuals follow a normal distribution. However, Observation 25 is a significant outlier with a Standardized Residual of 4.2, indicating the actual value was significantly higher than predicted.
- Constant Variance: Apart from the outlier, the residuals versus fits plot shows a relatively random scatter, suggesting the assumption of constant variance holds reasonably well.
- Independence: No distinct patterns or cyclic behavior are observed in the observation order plot, suggesting the data points are independent.
Recommendation: Investigate the experimental conditions for Observation 25 to rule out data entry errors or process anomalies.
Pareto Chart of Effects
In mixture designs, the standard Pareto chart must be interpreted with caution as it cannot fully separate component effects due to the sum-to-one constraint. However, it visually confirms that the MNP*Calcium interaction is statistically dominant.
To accurately rank the components, we look to the Cox Response traces. These traces confirm that MNP has the steepest positive slope, indicating it is the most sensitive driver of FM. Alginate shows a complex behavior; while its linear effect is minor, its strong negative interaction with MNP makes it a critical control factor for tuning the response.
Cox Response Trace Plot
Trace plot showing the sensitivity of the response to each component relative to a reference blend.
Optimization & Prediction
The optimizer predicts a maximum FM response of 0.9204. This optimum occurs at high Calcium levels (Coded=1.0) and high Alginate (1.0), with MNP set to 0.8. This result aligns with the model's positive three-way interaction coefficient (30.9), which suggests that when Calcium is high, the antagonism between Alginate and MNP is overcome, allowing for a maximized response. However, trade-offs must be considered: at this optimal point, the 'WC' response is negative (-0.4572) and 'FE_FE0' is low (-0.0701). Formulation engineers should verify if these secondary response values remain within acceptable specification limits.
Calculated Optimal Conditions (Maximized FM)
0.9204
Optimal Formulation
- Water 85.2664
- Alg 1.0
- MNP 0.8
- NcM2 12.9336
- Calcium_Real 5
Predictions for Other Responses
- WC -0.4572
- RE 0.5408
- FE_FE0 -0.0701
- Ms 0.7849
- E 0.2795
- I1 0.3694
- I2 0.4569
- I3 0.3942
- I4 0.4214
- I5 0.4004
Prediction Calculator
Enter component values to predict the response for FM.
Custom Prediction
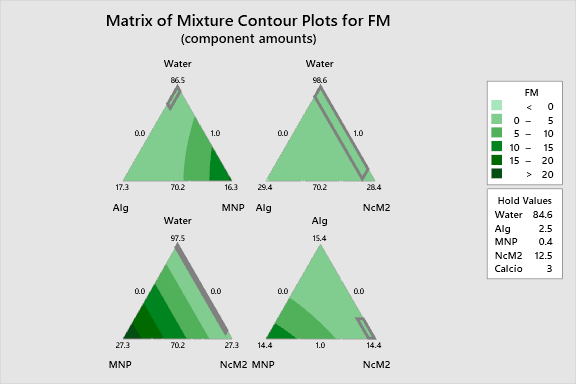
2D Contour Plots
The following interactive 2D contour plots show how pairs of variables influence the response while holding the other factors at constant levels. These maps are essential for identifying optimal regions in the formulation space. Specifically, observe the Alg vs. MNP plot: distinct curvature is visible due to the negative interaction (-48.2 coefficient), creating a ridge of optimal response rather than a simple linear gradient. The influence of Calcium is also evident, shifting the high-response regions as the process variable changes from low to high levels.
Alg Vs Mnp Fm
Alg Vs Ncm2 Fm
Mnp Vs Ncm2 Fm
3D Surface Plots
The following interactive 3D surface plots visualization provides a topographical view of the response surface. The topology reveals a complex twisting action caused by the three-way interaction Alg*MNP*Calcium. You will notice that the surface does not simply slope upward; instead, it exhibits a saddle or peak behavior where high levels of MNP combined with specific ratios of Alginate (dependent on Calcium level) yield the maximum FM values. This visualizes the trade-off inherent in the formulation.
3D representations of the response surface.