Analysis: I3
Key Findings and Interpretation
Dominant Factors and Interactions: The analysis reveals that the interaction between the mixture components and the process variable (Calcium) is critical. Specifically, the interaction NcM2*Calcium (T-value: 4.11, P-value: < 0.001) is the most statistically significant positive driver, suggesting that the effect of the Nostoc M2 cyanobacteria on the response I3 is heavily dependent on the Calcium concentration. Furthermore, strong mixture interactions were observed, particularly Water*MNP (Positive effect) and Alg*MNP (Negative effect). The large negative coefficient for Alg*MNP (-37.7) implies that simultaneously increasing Alginate and Magnetic Nanoparticles is detrimental to the response I3, which aligns with the optimization results favoring lower levels of these components.
Regression Equation
The following regression equation describes the mathematical relationship between the mixture components (Water, Alginate, MNP, NcM2), the process variable (Calcium), and the response variable I3. This equation includes linear blending terms and significant higher-order interaction terms selected via stepwise regression.
Model Goodness-of-Fit
The model demonstrates a strong fit to the experimental data, effectively capturing the complex behavior of the mixture-process system.
- R-sq (83.65%): The model accounts for approximately 83.7% of the total variation in the response I3, indicating a very good fit for a complex biological encapsulation process.
- R-sq(adj) (77.59%): This value adjusts for the number of terms in the model. The close proximity to the R-sq indicates that unnecessary terms have not been included.
- S (0.0509): The standard error of the regression is low relative to the response range (approx. 0.07 to 0.59), suggesting precise estimates of the response.
- R-sq(pred) (66.86%): While lower than the R-sq, it remains acceptable for a Design of Experiments (DOE) context, though it suggests caution when predicting at the extreme edges of the design space.
Model Summary: Stepwise Selection
The following table shows the stepwise selection process for the final model. The last row, highlighted, represents the chosen model with the best combination of explanatory and predictive power.
| Step | Term Added / Action | R-sq (%) | R-sq(adj) (%) | S |
|---|---|---|---|---|
| 1 | Linear Model (Base) | 47.28 | 42.63 | 0.0814 |
| 2 | + NcM2*Calcium | 60.57 | 55.79 | 0.0715 |
| 3 | + Water*MNP | 67.88 | 62.86 | 0.0655 |
| 4 | + Water*Alg | 75.07 | 70.25 | 0.0586 |
| 5 | + Alg*MNP | 77.98 | 72.84 | 0.0560 |
| 6 | + Water*Alg*Calcium | 80.39 | 74.98 | 0.0538 |
| 7 | + Alg*MNP*Calcium | 82.18 | 76.45 | 0.0522 |
| 8 | + Water*NcM2*Calcium | 83.65 | 77.59 | 0.0509 |
Model Diagnostic Plots
The diagnostic plots indicate that the model assumptions are generally satisfied, with no severe violations that would invalidate the analysis.
- Normality: The residuals generally follow a straight line on the Normal Probability Plot, suggesting the error terms are normally distributed.
- Constant Variance: The Residuals vs. Fits plot shows a random scatter of points across the range of fitted values (0.08 to 0.55). There is no distinct "megaphone" pattern, indicating homoscedasticity.
- Independence & Outliers: Most standardized residuals fall within the range of ±2.0. Observation 18 is a potential outlier with a Standardized Residual of -2.41, representing a case where the actual value (0.2333) was significantly lower than the fitted value (0.3483). However, as it is within ±3.0, it does not warrant removal without physical justification.
Pareto Chart of Effects
In mixture designs, the standard Pareto chart can be misleading because components are constrained (summing to 100%). While the Pareto chart visually ranks the standardized effects showing NcM2*Calcium and Water*Alg as the most significant terms relative to the noise, interpretation must be paired with Cox Response traces.
The Cox Response traces confirm that Alg*MNP drives the most dramatic changes in the response due to its large coefficient magnitude (-37.7), but the NcM2*Calcium interaction provides the most consistent and statistically certain positive impact (highest T-Value). This indicates that while MNP and Alginate ratios define the fundamental stability, the Calcium cross-linking with NcM2 is the primary "tuning knob" for maximizing I3.
Cox Response Trace Plot
Trace plot showing the sensitivity of the response to each component relative to a reference blend.
Optimization & Prediction
The optimizer predicts a maximum I3 response of 0.547. This optimal point is located at Water=73.2, Alg=1.0, MNP=0.8, NcM2=25.0, and Calcium=5 (Coded +1.0). This solution aligns with the regression coefficients: it minimizes the detrimental Alg*MNP interaction by keeping both Alginate and MNP at or near their lower bounds, while maximizing the beneficial NcM2*Calcium interaction by setting Calcium to its highest level. Trade-offs should be noted; while I3 is maximized here, other mechanical properties like Young's Modulus (E=0.2733) are predicted to be relatively low, suggesting a highly efficient but potentially softer encapsulation matrix.
Calculated Optimal Conditions (Maximized I3)
0.547
Optimal Formulation
- Water 73.2
- Alg 1.0
- MNP 0.8
- NcM2 25.0
- Calcium_Real 5
Predictions for Other Responses
- WC 0.4122
- RE 0.7078
- FE_FE0 0.101
- Ms 0.8802
- FM 0.9099
- E 0.2733
- I1 0.5099
- I2 0.6005
- I4 0.5588
- I5 0.4881
Prediction Calculator
Enter component values to predict the response for I3.
Custom Prediction
2D Contour Plots
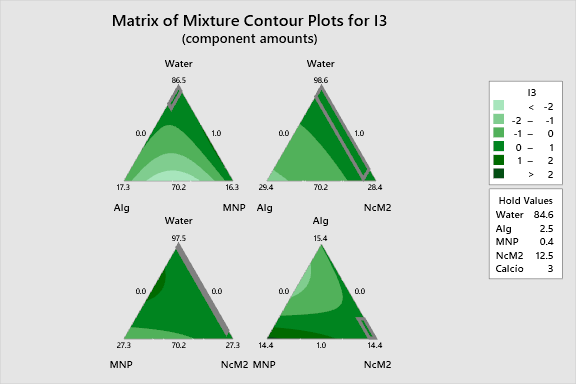
The following interactive 2D contour plots show how pairs of variables influence the response while holding the other factors at constant levels. These maps are essential for identifying optimal regions in the formulation space. Of particular interest is the interaction between Water and MNP; the curvature in the contours (indicated by the significant Water*MNP term) suggests that a synergistic effect exists, where specific ratios of hydration to nanoparticles maximize the response, provided Alginate is kept relatively low.
Alg Vs Mnp I3
Alg Vs Ncm2 I3
Mnp Vs Ncm2 I3
3D Surface Plots
The following interactive 3D surface plots visualization provides a topographical view of the response surface. The surface topology reveals a complex landscape characterized by a saddle point induced by the antagonistic Alg*MNP interaction. The steep gradient observed when Calcium increases (interacting with NcM2) confirms that the cross-linker concentration is a limiting factor—insufficient Calcium leads to a rapid drop in I3, regardless of the mixture ratio.
3D representations of the response surface.