Analysis: RE
Key Findings and Interpretation
Dominant Factors and Interactions: The analysis reveals that the interaction between NcM2 and Calcium (p < 0.001) is the most statistically significant driver of the response, suggesting that calcium crosslinking efficiency is heavily dependent on the NcM2 concentration. While the linear term for MNP shows a large negative coefficient (-12.52), indicating that increasing magnetic nanoparticles generally reduces RE, this effect is complex due to the marginally significant interaction between Water and MNP (p=0.068). The final optimized model relies heavily on 2-way interactions between the solvent (Water) and the solutes (Alg, MNP, NcM2) to accurately predict encapsulation efficiency.
Regression Equation
The relationship between the response RE and the mixture components is described by the following regression equation. This equation includes linear blending terms and second-order interaction terms selected through stepwise regression to maximize information criteria.
Model Goodness-of-Fit
The goodness-of-fit statistics indicate that the reduced model adequately approximates the true response surface within the experimental design space:
- R-sq (73.95%): Approximately 74% of the variation in RE is explained by the selected mixture components and their interactions.
- R-sq(adj) (67.87%): This adjusts for the number of predictors. The proximity to the non-adjusted R-sq confirms that unnecessary terms have been successfully pruned.
- Standard Error (S = 0.1600): The standard deviation of the data points around the fitted regression line is 0.1600 units, providing an estimate of the typical prediction error.
Model Summary: Stepwise Selection
The following table shows the stepwise selection process for the final model. The last row, highlighted, represents the chosen model with the best combination of explanatory and predictive power.
| Step | Term Added | R-sq (%) | R-sq(adj) (%) | S |
|---|---|---|---|---|
| 1 | Linear Terms (Base) | 46.50 | 41.78 | 0.2154 |
| 2 | NcM2 * Calcium | 60.04 | 55.20 | 0.1890 |
| 3 | Water * NcM2 | 68.07 | 63.08 | 0.1716 |
| 4 | Water * MNP | 71.09 | 65.49 | 0.1659 |
| 5 | Water * Alg | 73.95 | 67.87 | 0.1600 |
Model Diagnostic Plots
The diagnostic plots were evaluated to validate the assumptions of the ANOVA and regression analysis. Overall, the residuals do not show severe deviations that would invalidate the model, though caution is warranted regarding specific observations.
- Normality: The Normal Probability Plot generally follows a straight line, though the tails show slight deviation. The Standardized Residuals indicate potential outliers, specifically Observations 2 (StdResid 2.11) and 3 (StdResid 2.39), which deviated significantly from the fit.
- Constant Variance: The Residuals vs. Fits plot displays a relatively random scatter of points around zero. There is no distinct "megaphone" pattern, suggesting the assumption of homoscedasticity is met sufficient for analysis.
- Independence: Assuming the run order was randomized, the residuals do not display trending over time. However, the presence of outliers suggests specific experimental runs may have been subject to external noise or measurement error.
Pareto Chart of Effects
In mixture designs, the standard Pareto chart cannot be used in isolation to rank variables due to the implicit constraint (components sum to 1). Therefore, we utilize Cox Response traces alongside the t-statistics.
"The Pareto chart visually ranks the standardized effects, highlighting the NcM2*Calcium interaction as the most significant term beyond the threshold."
However, the Cox Response traces confirm that MNP has the steepest negative slope, indicating it is the most sensitive driver for reducing the response. Conversely, NcM2 exhibits a positive slope, reinforced by its positive interaction with Calcium. This duality indicates that while the Calcium interaction is statistically stabilizing, the concentration of MNP is the primary lever for large-magnitude changes in RE.
Cox Response Trace Plot
Trace plot showing the sensitivity of the response to each component relative to a reference blend.
Optimization & Prediction
The optimizer predicts a maximum RE of 1.0417 at the formulation: Water=74%, Alg=1%, MNP=0%, and NcM2=25%, with Calcium at level 5. This result aligns perfectly with the model coefficients: MNP is driven to its lower bound (0.0) to negate its large negative coefficient (-12.52), while NcM2 is maximized to exploit its positive linear and interaction effects. However, a significant trade-off exists. While this formulation maximizes Encapsulation Efficiency, the predicted Magnetic Saturation (Ms) is effectively zero (0.0272), and Young's Modulus (E) is moderate. This implies the optimal formulation for RE produces a high-integrity but non-magnetic capsule.
Calculated Optimal Conditions (Maximized RE)
1.0417
Optimal Formulation
- Water 74.0
- Alg 1.0
- MNP 0.0
- NcM2 25.0
- Calcium_Real 5
Predictions for Other Responses
- WC 0.5424
- FE_FE0 0.7583
- Ms 0.0272
- FM -0.0009
- E 0.2458
- I1 0.6116
- I2 0.528
- I3 0.4924
- I4 0.5377
- I5 0.5229
Prediction Calculator
Enter component values to predict the response for RE.
Custom Prediction
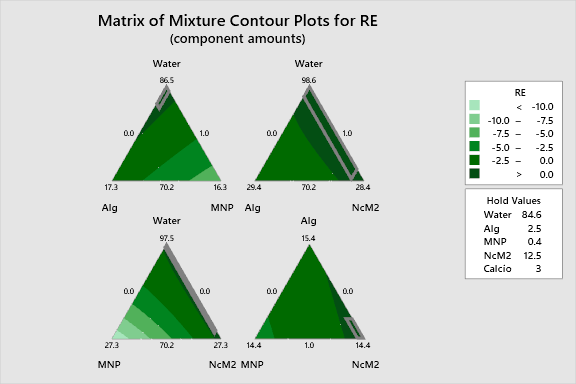
2D Contour Plots
The following interactive 2D contour plots show how pairs of variables influence the response while holding the other factors at constant levels. These maps are essential for identifying optimal regions in the formulation space. The curvature of the isolines clearly demonstrates the synergistic effect between Water and the hydrogel polymers (Alg/NcM2). The plots reveal a distinct region of maximization where NcM2 is high and MNP is minimized, visualizing the trade-offs quantified by the regression coefficients.
Alg Vs Mnp Re
Alg Vs Ncm2 Re
Mnp Vs Ncm2 Re
3D Surface Plots
The following interactive 3D surface plots visualization provides a topographical view of the response surface. The topology exhibits a rising ridge toward the vertex associated with high NcM2 content. The surface curvature is convex (upward bending) due to the positive interaction coefficients (particularly Water*MNP and Water*Alg). This suggests that the response does not increase linearly but accelerates as specific favorable ratios of solvent-to-polymer are achieved, particularly in the presence of Calcium crosslinking.
3D representations of the response surface.