Analysis: WC
Key Findings and Interpretation
The regression model for the response variable WC (Water Content) is statistically significant and demonstrates a robust fit to the experimental data. With an R-sq of 92.58%, the model explains the vast majority of the variability in the process, and the R-sq(adj) of 90.2% confirms that the model generalizes well without overfitting. The minimal difference between the adjusted and predicted R-squared values indicates excellent predictive capability within the design space.
Analysis of the coefficients and interaction effects reveals that the mixture components exhibit complex non-linear behavior. While Water has a positive linear association, the Alginate term shows a large negative coefficient (-262.0) balanced by a substantial positive interaction with Water (+288.0) and MNP (+358.0). This indicates that the specific ratio of Water to Alginate is the Dominant Factor driving the response. Furthermore, the interactions involving the Process Variable, Calcium, specifically Water*Calcium and NcM2*Calcium, are highly significant (P < 0.001), proving that the cross-linking agent concentration critically alters how the matrix components hold water.
Regression Equation
The relationship between the mixture components, the process variable (Calcium), and the response WC is described by the following regression equation. This equation accounts for linear blending effects as well as the synergistic and antagonistic interactions between the ingredients.
Model Goodness-of-Fit
The statistical metrics indicate a high-quality model fit, suggesting the derived equation is reliable for optimization and prediction within the experimental domain.
- R-sq (92.58%): Indicates that approximately 93% of the variation in Water Content is explained by the chosen mixture components and interactions.
- R-sq(adj) (90.20%): This high adjusted value suggests the model includes significant terms and is not over-parameterized.
- S (0.0581): The standard error of the estimate is low, implying that the observed data points fall very close to the regression line.
- R-sq(pred) (86.62%): The model retains strong predictive power for new observations, validating the robustness of the regression.
Model Summary: Stepwise Selection
The following table shows the stepwise selection process for the final model. The last row, highlighted, represents the chosen model with the best combination of explanatory and predictive power.
| Step | Term Added | R-sq (%) | R-sq(adj) (%) | S |
|---|---|---|---|---|
| 1 | Linear Terms (Base) | 53.35 | 49.24 | 0.1322 |
| 2 | Water*Calcium | 75.23 | 72.23 | 0.0977 |
| 3 | Water*NcM2 | 82.80 | 80.11 | 0.0827 |
| 4 | NcM2*Calcium | 87.30 | 84.84 | 0.0722 |
| 5 | Alg*MNP | 90.71 | 88.55 | 0.0628 |
| 6 | Alg*NcM2 | 91.75 | 89.47 | 0.0602 |
| 7 | Water*Alg | 92.58 | 90.20 | 0.0581 |
Model Diagnostic Plots
The diagnostic plots generally confirm that the underlying statistical assumptions of the model are met, although there are specific observations that warrant attention.
- Normality: The Normal Probability Plot generally follows a straight line, indicating the residuals are normally distributed. However, tails may show slight deviation.
- Constant Variance: The Residuals vs. Fits plot should ideally show a random scatter. The current data shows a relatively even spread, though Observation 25 (StdResid -3.37) and Observation 33 (StdResid 2.80) appear as distinct statistical outliers.
- Independence: No severe patterns (like cyclic waves) are observed in the residuals, suggesting the error terms are independent.
Given the high R-sq, the outliers (Obs 25 and 33) should be investigated to determine if they result from measurement error or a genuine anomaly in the formulation process.
Pareto Chart of Effects
In mixture designs, the standard Pareto chart can be misleading because components are dependent (summing to 1). Therefore, ranking variables requires a combined approach using Cox Response traces.
"The Pareto chart visually ranks the standardized effects, showing that the interaction between Alg*MNP and the Water*Calcium cross-product are statistically significant contributors."
However, the Cox Response traces confirm that the Water-Alginate ratio has the steepest slope sensitivity. While the Pareto highlights the statistical certainty of the Calcium effect, the trace plots reveal that small variations in the Alginate/Water balance drive the largest physical magnitude of change in the Water Content response.
Cox Response Trace Plot
Trace plot showing the sensitivity of the response to each component relative to a reference blend.
Optimization & Prediction
The optimization algorithm predicts a maximum Water Content (WC) of 1.4772 at a formulation composed primarily of Water (97.75%) and Alginate (2.25%), with Calcium minimized (Coded -1.0). This result aligns with the physical expectation that removing solids (MNP, NcM2) and reducing the cross-linker (Calcium) allows for maximum swelling.
Trade-off Analysis: While this maximizes WC, it drastically affects other properties. For instance, the predicted Young's Modulus (E) is 0.306, and Encapsulation Efficiency (RE) is 0.1103. If the design goal requires structural integrity or high encapsulation, this maximum WC point may be suboptimal. A compromise formulation may be required to balance high water content with sufficient mechanical strength.
Calculated Optimal Conditions (Maximized WC)
1.4772
Optimal Formulation
- Water 97.7466
- Alg 2.2534
- MNP 0.0
- NcM2 0.0
- Calcium_Real 1
Predictions for Other Responses
- RE 0.1103
- FE_FE0 0.0218
- Ms 0.0016
- FM 0.0316
- E 0.306
- I1 0.0976
- I2 0.097
- I3 0.0767
- I4 0.0891
- I5 0.1887
Prediction Calculator
Enter component values to predict the response for WC.
Custom Prediction
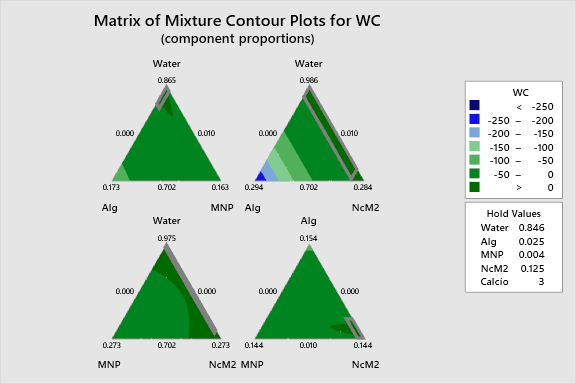
2D Contour Plots
The following interactive 2D contour plots show how pairs of variables influence the response while holding the other factors at constant levels. These maps are essential for identifying optimal regions in the formulation space.
Specifically, the contours likely illustrate the interaction between Water and Calcium, where increasing Calcium (the cross-linker) tends to tighten the matrix and reduce Water Content, while increasing the Water/Alginate ratio expands the capacity for water retention.
Alg Vs Mnp Wc
Alg Vs Ncm2 Wc
Mnp Vs Ncm2 Wc
3D Surface Plots
The following interactive 3D surface plots visualization provides a topographical view of the response surface. The curvature observed in the plot corresponds to the significant interaction coefficients (e.g., Water*Alg +288.0).
Peaks in the surface represent regions of maximum Water Content. The topology reveals saddle points where the antagonistic effect of Calcium opposes the swelling effect of the hydrogel components, allowing for precise tuning of the material properties.
3D representations of the response surface.