Martina DOE 2026
Dynamic Analysis Dashboard
Project Description
This scientific project utilizes a combined Mixture and Process Design of Experiments (DOE) approach to systematically optimize the formulation and production of highly stable and functionalized Alginate Hydrogel Beads. These beads are intended for advanced applications such as targeted drug delivery systems, enzyme immobilization, or environmental remediation requiring magnetic separation capabilities.
The core objective is to understand the complex interactions between the structural components and the cross-linking mechanism. The Mixture Design focuses on balancing the structural integrity provided by Alginate (Alg, the primary gelling agent) against the incorporation of the functional additive, Magnetic Nanoparticles (MNP, required for magnetic responsiveness), and a significant secondary component (NcM2), which may influence bead porosity, encapsulation efficiency, or structural modulus.
The study specifically investigates the concentration range of the critical ingredients: low Alginate concentrations (1.0% to 4.0%) ensure injectability or easy processing, while MNP concentration is tightly controlled (up to 0.8%) to maximize magnetic moment without compromising the structural matrix. The highly variable NcM2 component (up to 25%) allows for broad exploration of secondary matrix influences.
Furthermore, the critical process variable, Calcium ion concentration, is tested at two distinct levels (1 mM and 5 mM). Since Calcium dictates the rate and extent of ionic cross-linking in alginate, testing these levels will reveal the formulation's sensitivity to cross-linker density, ultimately determining the final bead properties such as mechanical strength, swelling ratio, and material erosion rate. The resulting data will yield a predictive model for producing beads that simultaneously meet stringent requirements for magnetic susceptibility and mechanical robustness.
minitab_models.json configuration.
Experimental Design (DOE)
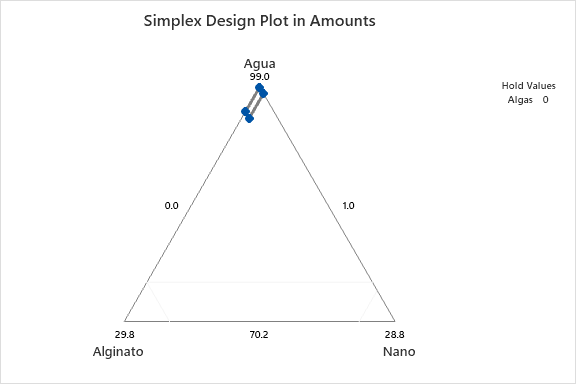
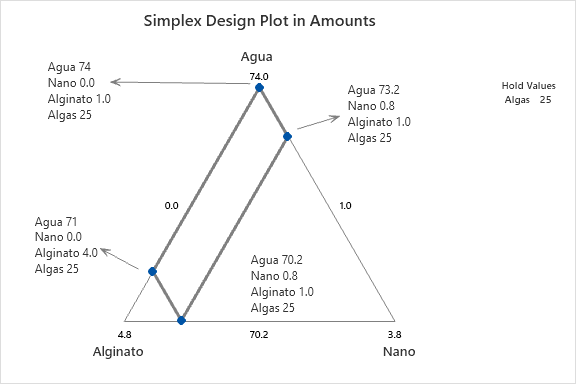
To understand how each component influences the final properties of the beads, an Extreme Vertices Mixture Design was employed. This statistical method is highly effective for optimizing formulations where components are subject to specific constraints.
The experiment is based on 4 mixture components and 1 process variable, evaluated over 38 experimental runs to construct a robust predictive model. The components and their respective ranges in the formulation (totaling 100%) are as follows:
- Component A (Water): 70.2% - 99.0%
- Component B (Alginate): 1.0% - 4.0%
- Component C (MNPs): 0.0% - 0.8%
- Component D (NcM2): 0.0% - 25.0%
The design matrix includes points at the vertices and centroids of the experimental region, with replications at the central point to ensure the accuracy of the quadratic model. Each analysis presented on this page utilizes the data from this DOE to generate contour plots, response surfaces, and statistical models. These results allow for the visualization of how variations in ingredient proportions impact the final properties of the beads, such as swelling capacity or magnetic response.
Available Analyses
WC Analysis
Click below to view the detailed statistical analysis, plots, and response surfaces for WC.
View AnalysisRE Analysis
Click below to view the detailed statistical analysis, plots, and response surfaces for RE.
View AnalysisFE_FE0 Analysis
Click below to view the detailed statistical analysis, plots, and response surfaces for FE_FE0.
View AnalysisMs Analysis
Click below to view the detailed statistical analysis, plots, and response surfaces for Ms.
View AnalysisFM Analysis
Click below to view the detailed statistical analysis, plots, and response surfaces for FM.
View AnalysisE Analysis
Click below to view the detailed statistical analysis, plots, and response surfaces for E.
View AnalysisI1 Analysis
Click below to view the detailed statistical analysis, plots, and response surfaces for I1.
View AnalysisI2 Analysis
Click below to view the detailed statistical analysis, plots, and response surfaces for I2.
View AnalysisI3 Analysis
Click below to view the detailed statistical analysis, plots, and response surfaces for I3.
View AnalysisI4 Analysis
Click below to view the detailed statistical analysis, plots, and response surfaces for I4.
View AnalysisI5 Analysis
Click below to view the detailed statistical analysis, plots, and response surfaces for I5.
View AnalysisMulti-Response Optimizer
Key Features:
- Weighted Objectives: Define as many responses as you want to optimize with flexible goals ('maximize', 'minimize', 'target').
- Hard Constraints: If a response falls outside your defined Lower/Upper limits, its desirability drops to 0, forcing the optimizer to find a valid solution.
- Scipy Integration: Uses
scipy.optimize.minimize(SLSQP) to maximize the Composite Desirability (D), the geometric mean of all component scores.